|
|
Last updates:
Thu Oct 13 15:29:24 2005
Fri Oct 14 11:46:19 2005
Thu Oct 20 07:50:34 2005
Thu Dec 24 10:28:59 2015
Thu Mar 23 14:05:36 2017
![]()


S-Plus is an extension of the statistics and data-analysis language, S, developed at AT&T Bell Laboratories about 1980. S-Plus appeared about 1992, and is now supported and developed by a commercial company, Insightful Corporation.
R is a reimplementation of S-Plus developed by a team of researchers and freely distributed under the GNU General Public License and available on the Web as The R Project for Statistical Computing, including the notable, and large, Comprehensive R Archive Network with almost 7700 packages in late 2015.
What books are available for S-Plus and R?
About 235 of them (in late 2015): see the extensive s-plus bibliography. There are also related resources, including bibliographies of R News, its successor, the R Journal, and the Journal of Statistical Software. The latter has about 390 papers on library packages for R and S-Plus.
More generally, there is broad literature coverage of the subject area of probability and statistics in 145+ bibliographies of 54+ major journals.
Are S-Plus and R interchangeable?
Yes, to a substantial degree. Several of the books in the subject use both, and some may discuss compatibility issues.
What documentation is available online for S-Plus and R?
The S-Plus vendor has historically provided a large collection of S-Plus documents in PDF format. For a complete list, search the FILES files in the S-Plus installation tree:
% fgrep .pdf /usr/local/sys/splus/splus*/FILES
/usr/local/sys/splus/splus60_r2/doc/getstart.pdf
/usr/local/sys/splus/splus60_r2/doc/instman.pdf
/usr/local/sys/splus/splus60_r2/doc/pguide.pdf
...
The R Project team has several online manuals in HTML and PDF.
There is also online help inside S-Plus and R: type a question mark followed by a topic or function name. Here is an example for S-Plus:
% Splus
...
> ? sqrt
                                            Exponential Functions

DESCRIPTION:

   Returns the exponential, logarithm, or square root of the input.

USAGE:

exp(x)
log(x)
logb(x, base=exp(1))
log10(x)
sqrt(x)
...
What versions of S-Plus and R do we have?
We maintain several historical versions of these systems. You can see what they are like this:
% which Splus R
/usr/local/bin/Splus
/usr/local/bin/R

% ls /usr/local/bin/Splus*
/usr/local/bin/Splus    /usr/local/bin/Splus-3.4   /usr/local/bin/Splus-6.0r2
/usr/local/bin/Splus6

% ls /usr/local/bin/R /usr/local/bin/R-*
/usr/local/bin/R        /usr/local/bin/R-1.8.0     /usr/local/bin/R-2.1.0
/usr/local/bin/R-1.5.1  /usr/local/bin/R-1.9.1     /usr/local/bin/R-2.1.1
/usr/local/bin/R-1.6.2  /usr/local/bin/R-2.0.0

% file /usr/local/bin/Splus
/usr/local/bin/Splus: symbolic link to `Splus-6.0r2'

% file /usr/local/bin/R
/usr/local/bin/R: symbolic link to `R-2.1.1'
Evidently, for both programs, the default version is the latest one.
How do I use high-precision arithmetic?
You cannot. S-Plus and R carry out computations in IEEE 754 double-precision arithmetic, which provides almost 16 decimal digits of precision, and a number range from about 10-324 to 10308. Neither supports computation at higher precision.
You can, however, use them as simple symbolic calculators:
% R
...
> sqrt(pi/2) * sin(3.5*pi) * exp(-3.5)
[1] -0.03784681
> print(sqrt(pi/2) * sin(3.5*pi) * exp(-3.5), digits = 16)
[1] -0.03784680755312850
> options(digits = 16)
> sqrt(pi/2) * sin(3.5*pi) * exp(-3.5)
[1] -0.03784680755312850
How do I make a simple 2-D function plot?
S-Plus is particularly rich in graphical display of data, a task that was a major design goal of the language. However, in this FAQ, we only demonstrate simple examples.
The S-Plus plot() function expects vector arguments, rather than symbolic expressions, so we first create a vector of uniformly spaced values, and then plot a vector expression:
% Splus
...
x <- seq(-5, 5, 0.001)
plot(x,sin(x)/x)
This produces a pop-up window from which we can make a screen dump by running the X Window Dump command in a separate terminal window, piping its output into the ImageMagick format-conversion tool:
% xwd | convert - sin-x-over-x.png
xwd waits for you to move the pointer into the desired window and click the mouse to make the snapshot.
Another way to make the screen dump is to convert it to Portable Network Map (PNM) format, and then to PNG format:
% xwd | xwdtopnm | pnmtopng > sin-x-over-x.png
The resulting snapshot is quite large, so we first make a half-size version:
% pngtopnm sin-x-over-x.png | pnmscale -reduce 2 | \
  pnmtopng > half-size-sin-x-over-x.png
The half-size image looks like this:
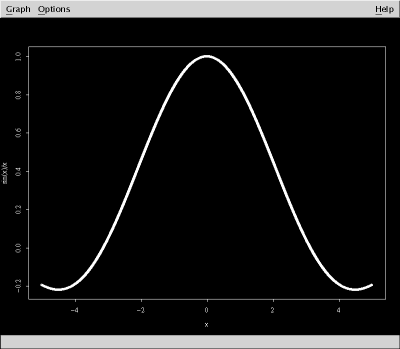
The curve is thick because S-Plus and R by default plot a crosshair at each point. With an extra argument in the plot() call, we can connect the points with line segments instead:
> plot(x, sin(xx)/xx, type="l")
The plot is similar to the one shown above, except that the curve is thin.
The Options -> Color Scheme menu path allows you to select black-on-white instead of the default white-on-black (chosen because it makes color easier to see).
The Options -> Printing menu path menu lets you choose landscape or portrait orientation, output to either PostScript or HP LaserJet formats, and the command to use for `printing', which might be something like cat > myplot.eps to instead save in a file. The PostScript plot is black on white, independent of the original color scheme.
Although you cannot interact directly with the plot to change its appearance, you can mark points on the plot with the help of the identify() function:
> identify(x, sin(x)/x)
Mouse clicks in the plot window then report a data-point number that is displayed. In this plot made with the type = "l" argument, we marked five such points:
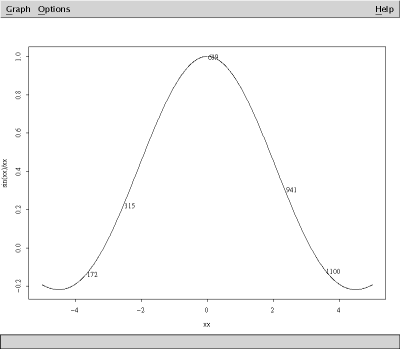
Mouse button 1 marks points, and mouse button 2 terminates the point collection. The identify() function then returns a vector containing the selected data-point numbers:
> identify(x, sin(x)/x)
[1] 172 315 639 941 1100
A typical use of such a result is the visual identification of outliers in experimental data.
The same plotting commands in R produce a large pop-up window with a black-on-white image. Unfortunately, the ImageMagick convert utility loses the axis labeling when it scales the image to half size, so we use the NetPBM tools instead:
% xwd | convert - sin-x-over-x-r.png

% pngtopnm sin-x-over-x-r.png | pnmscale -reduce 2 | \
  pnmtopng > half-size-sin-x-over-x-r.png
Here is what the half-size image looks like:
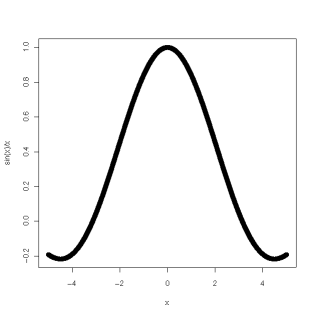
The identify() function works in R just as it does with S-Plus, so we don't show a sample plot with marked points.
How do I make a 3-D surface plot?
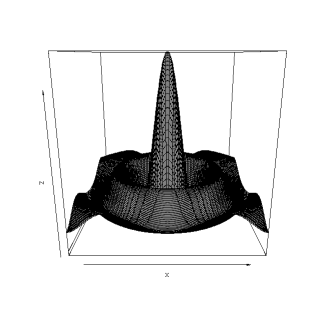
As with 2-D plots, S-plus creates surfaces by plotting points, not functions, so you have to create suitable coordinate arrays first:
% Splus
...
> x <- seq(-12, 12, 1/8)
> y <- x
> z <- matrix(0,length(x),length(y))
> for (i in 1:length(x))
+     for (j in 1:length(y))
+         z[i,j] <- sin(sqrt(x[i]^2 + y[j]^2)) / sqrt(x[i]^2 + y[j]^2)
> persp(x,y,z)
We can make a snapshot like this:
% xwd | convert - hat.png
Next, we make a companion file of half the original size like this:
% identify hat.png
hat.png PNG 800x697 PseudoClass 5c 8-bit 21300b 0.1u 0:01

% convert -scale 400x349 hat.png half-size-hat.png
When scaling an image that has a dimension that is an odd number of pixels, round the scaled value upward: thus, 697 / 2 -> 349.
The half-size plot looks like this:
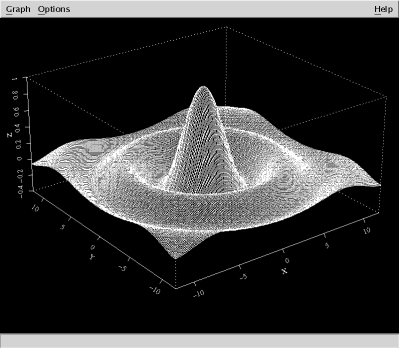
The same plotting commands in R produce a large pop-up window with a black-on-white image. As before, we create a window dump, and then scale it to half size:
% xwd | convert - hat-r.png

% pngtopnm hat-r.png | pnmscale -reduce 2 | \
  pnmtopng > half-size-hat-r.png
The half-size plot looks like this:
I'm working on machine X. Why does it not have S-Plus or R?
The S-Plus vendor supports only a few of the architectures that we have, and because each platform costs additional license fees, we provide it only on Sun Solaris SPARC systems.
While R is freely available, it is a large and complex system (more than 265,000 lines of C and 146,000 lines of Fortran), and there are frequently build problems on several platforms. We have at least one version of each of our systems (although the latest version does not build on all of them), except for Apple Mac OS X, where no build attempt has yet succeeded.
I tried to start S-Plus, but it refused because of too many concurrent users. What can I do?
Wait a half hour or so, and then retry. If the problem persists, ask systems staff for help. The number of S-Plus licenses that we purchase has normally been sufficient.
Is there a local mailing list for questions about S-Plus and/or R?
Yes: the Splus-users list is a (currently low-volume) list where such questions may be posted, and there is an archive of past postings available from a link near the top of its Web page.
Is there a graphical user interface (GUI) for R?
From late summer of 2015, we have been able to offer the rstudio program that provides a GUI for R. It is available only on our CentOS 6 and 7 systems (the ones that the majority of our users normally access). Attempts to build that GUI from source code for other Unix operating have not been successful: it simply has too many dependencies on too many libraries that are available only on very recent flavors of GNU/Linux with bleeding-edge C++ language support.
If you have a personal computer, you may be able find suitable downloadable binary distributions from the RStudio Web site, which offers both free, and commercially supported, versions.
There is another GUI for R called rkward, but it is not yet available in CentOS and Red Hat GNU/Linux distributions. However, it can be found in the package systems for Debian, Fedora, openSUSE, Ubuntu, and possibly other flavors of GNU/Linux, as well as in package managers for Apple Mac OS X, DragonFlyBSD, FreeBSD, GNU/Hurd, and Microsoft Windows.
How can I install additional libraries for R?
You cannot yourself on our systems, but systems staff can do so on request. Such attempts are not always successful, because R packages can be written in any combination of up to four languages (C, C++, Fortran, and R), and because R packages often depend on several other R packages. Quite often, we have found that one or more links of those sometimes-long dependency chains break, failing to compile on at least some of our systems. Nevertheless, we have had considerable success, with some of our systems now offering about 220 different R packages built here from source code.
If you have a personal computer on which you have administrator access, then you may be able to install R and any additional libraries that you require via your binary package manager. For example, recent Debian and Ubuntu releases have from 200 to 500 R packages available that way, Fedora releases have about 100, and DragonFlyBSD and FreeBSD systems have about 150.