|
|
Last update(s):
Mon Oct 17 18:36:42 2005
Thu Oct 20 17:17:15 2005
![]()
MuPAD (Multiprocessing Algebra Data Tool) is a programming language for symbolic algebra and high-precision decimal integer and floating-point arithmetic.
Its development started about 1990 at the University of Paderborn, Paderborn, Germany, and was later spun off into a separate commercial company that is now known as SciFace Software GmbH & Co. KG.
Our department is an official mirror site at ftp://ftp.math.utah.edu/pub/mupad and http://www.math.utah.edu/pub/mupad of the Paderborn distribution of MuPAD.
What books are available for MuPAD?
About 15 of them: see the MuPAD bibliography.
What documentation is available online for MuPAD?
The MuPAD distribution contains the file http://www.math.utah.edu/pub/mupad/doc/pdf_help.zip with 40 manuals containing about 2600 pages of typeset documentation. Each of the manuals are listed in the MuPAD bibliography.
There is also a help system inside MuPAD. In a MuPAD session, type a question mark followed by a function name or topic:
% mupad
...
>> ?sqrt
sqrt -- the square root function

Introduction

 sqrt(z) represents the square root of z.
...
What version of MuPAD do we have?
Normally only the current version is installed (MuPAD version 2.5.2 in Fall 2005 on Sun Solaris SPARC, and 2.5.3 on GNU/Linux):
% mupad -V
2.5.2

% which mupad
/usr/local/bin/mupad

% ls /usr/local/bin/mupad*
/usr/local/bin/mupad
How do I use high-precision arithmetic?
Set the DIGITS variable to the desired decimal precision, and then enter numerical expressions for evaluation. Here is an example:
% mupad
...
>> DIGITS := 50:
>> erfc(-7.5)

            1.9999999999999999999999999722335061396943089933603
>> sin(1/256.0) / (1/256.0)

           0.99999745687042983799221222193087945750276128903456

>> 40!

             815915283247897734345611269596115894272000000000
How do I make a simple 2-D function plot?
Use the plot() and plot::Function2d() functions in an xmupad GUI session. This creates a pop-up window with the graph. Here is an example:
% xmupad
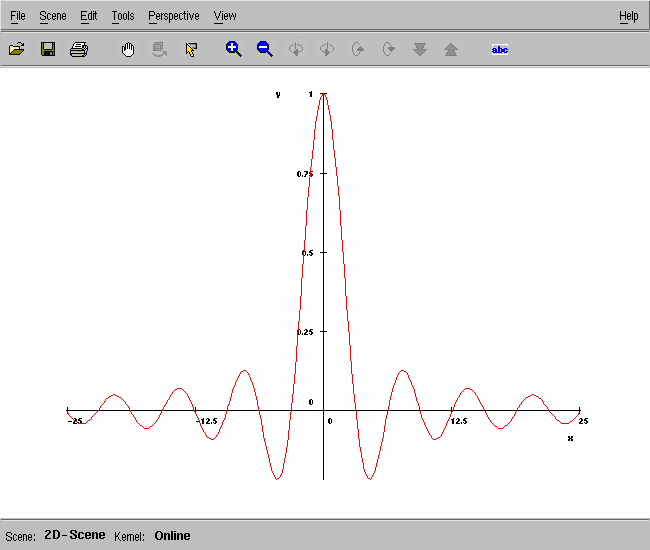
>> plot(plot::Function2d(sin(x)/x, x = -25 .. 25));
The File -> Export menu lets you save the graph in PostScript, JPEG, PNG, and TIFF formats. Alternatively, you can capture a snapshot of the pop-up window by running the X Window Dump command in a separate terminal window, piping its output into the ImageMagick format-conversion tool:
% xwd | convert - sin-x-over-x.png
xwd waits for you to move the pointer into the desired window and click the mouse to make the snapshot.
Another way to make the screen dump is to convert it to Portable Network Map (PNM) format, and then to PNG format:
% xwd | xwdtopnm | pnmtopng > sin-x-over-x.png
Here is what the plot-window snapshot looks like:
How do I make a 3-D surface plot?
Use the plot() and plot::Function3d() functions in an xmupad GUI session. This creates a pop-up window with the graph. Here is an example:
% xmupad
>> plot(plot::Function3d(sin(sqrt(x^2 + y^2)) / sqrt(x^2 + y^2),
       x = -12 .. 12, y = -12 .. 12));
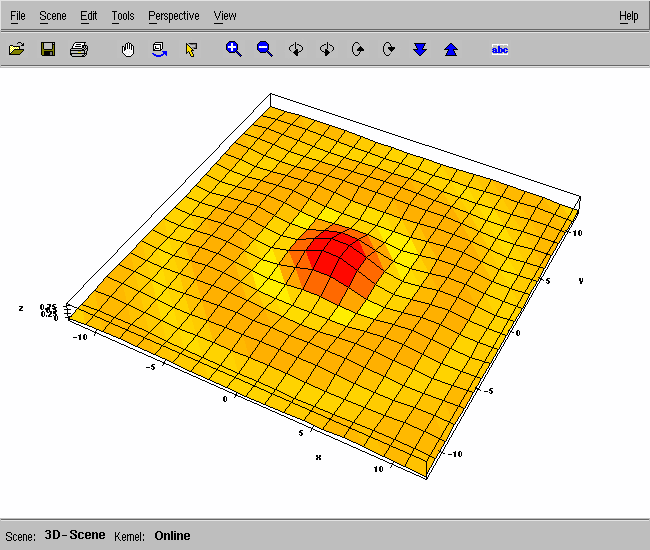
Here is what a screen dump of the surface plot looks like (see the 2-D plotting question above for how to make such a dump):
The toolbar buttons allow you to rotate, tilt, pan, and rotate the plot interactively.
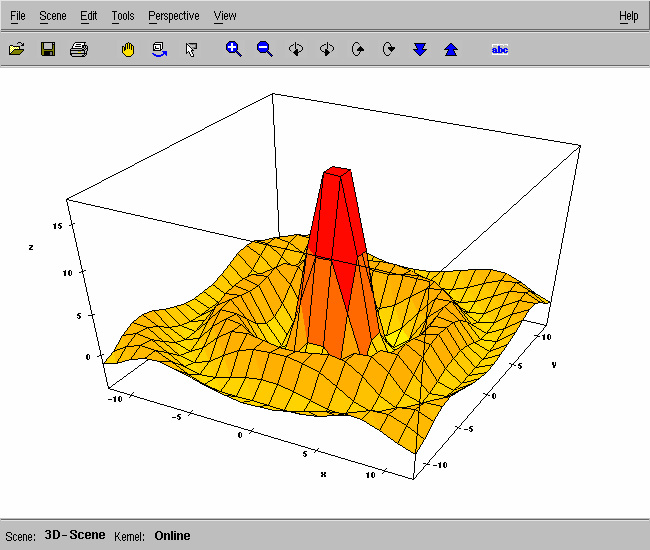
However, as you can see from the picture above, the default vertical extent has been shortened so drastically that the shape of the surface is not evident. In contrast to other programming systems (for example, Maple, Mathematica, and Matlab) that provide for similar kinds of surface plots, MuPAD seems to require uniform scaling of the three axes. There appears to be no option to choose automatic rescaling of the function values. This is unfortunate, since the function values may have a radically different range than the function arguments, (x,y). Fortunately, rescaling the function provides an easy fix:
% xmupad
>> plot(plot::Function3d(20 * sin(sqrt(x^2 + y^2)) / sqrt(x^2 + y^2),
       x = -12 .. 12, y = -12 .. 12));
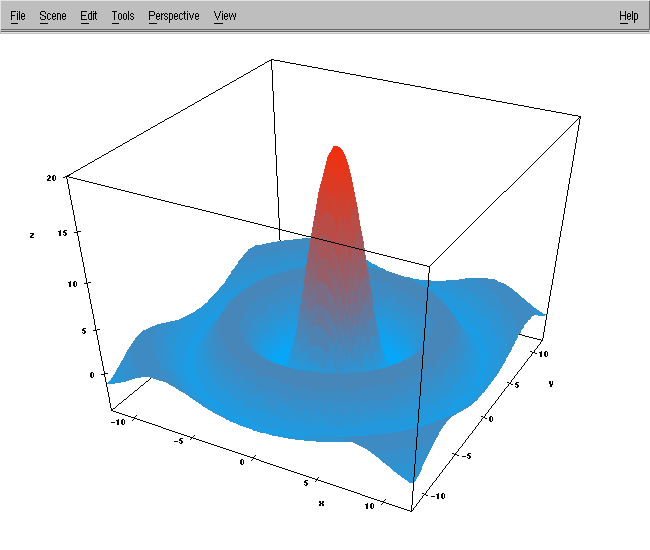
The rescaled plot looks like this:
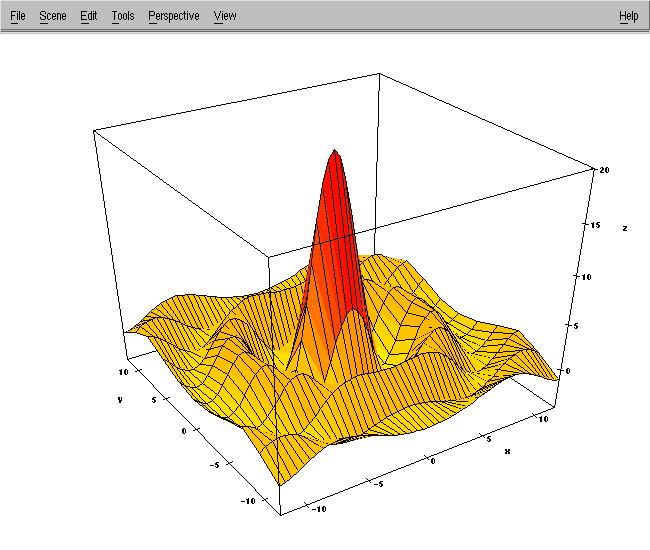
The default mesh size of 20×20 may be too coarse for some applications. The Grid option can be used to specify an alternate size, which need not even be a square mesh:
>> plot(plot::Function3d(sin(sqrt(x^2 + y^2)) / sqrt(x^2 + y^2),
       x = -12 .. 12, y = -12 .. 12,
       Grid = [51,11]));
Here is what a screen dump looks like, after using the toolbar options to produce a different view, and then remove the statusbar and toolbar:
Here is a final plot, produced on a 91×91 grid, with tweaks in the Edit -> Object Properties pop-up panel to alter the start and end colors, and change the drawing style to ColorPatches:
I'm working on machine X. Why does it not have MuPAD?
The MuPAD vendor supports only a few of the architectures that we have. We install it on Sun Solaris SPARC and GNU/Linux AMD64, IA-32, and IA-64 systems.
Is there a local mailing list for questions about MuPAD?
No, there is not, but one can easily be created if there is sufficient user demand. In the meantime, students who use MuPAD in courses should direct their questions to their instructors.