 |
 |
 |
 |
Fig. 1: Waves of excitation following high frequency stimulation at the apex.
 |
Fig. 2: Wave pattern (a single spiral) on the ventricular surface, during monomorphic tachycardia.
 |
Fig. 3:Ventricular cross section showing reentrant activity (a scroll) during monomorphic tachycardia.
 |
 |
Fig. 4: View of the three dimensional structure of a single scroll wave.
 |
 |
Fig. 5: Scroll wave reentant pattern on the surface of the ventricles, and on cut-away section.
 |
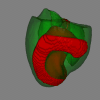
Fig. 6: Transparent view of scroll wave.
The following are extra unpublished figures:
 |
 |
 |
Normal propagation following a single stimulus applied at the apex of the ventricles.
 |
 |
Another view of normal waves. Here the stimulus was applied to the endocardial wall of the left ventricle.
 |
Add some relevant comments about these figures.
 |
 |
 |
 |
 |
 |
 |
 |
Add some relevant comments about these figures.
 |
 |
 |
 |
Add some relevant comments about these figures.
 |
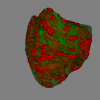
The surface view during ventricular fibrillation.
 |
 |
 |
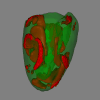
Transparent view of spiral wave breakup and fibrillation onset.